Fulham's Property Market Slows and Flat Prices Slide
Overall average price dragged down by fewer sales of luxury apartments
Property sales in Fulham slowed in the final quarter of 2016, with just 106 transactions, or around one per day, recorded by the Land Registry.
This total could rise slightly as further late processed sales are added, but it's a long way from the 500 sales achieved over three months when the market was at its peak.
Again, like the previous quarter, there was little activity at the top of the market between October and December, with just two semi-detached houses being sold.
During these three months, traditionally a quiet time for estate agents in the run-up to Christmas, there was also a dramatic drop in the number of terraced houses changing hands - just 31, down by 35.4% from 48 between July and September. However, prices rose by a modest 2.5% to reach £1,734,565.
By contrast there was a very sharp fall in the average flat price, down by 21.1% to £757,000. Again this was due to the lack of activity in this sector, with overall sales almost halved to just 73, from 141 in the previous quarter.
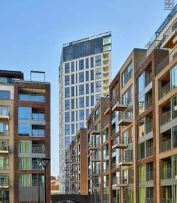
In the previous quarter, the Land Registry recorded a large number of sales of luxury apartments at St George's upmarket development Chelsea Creek, with price tags of up to £6 million.
This time, however there were just four sales at the development in Imperial Road, all in Chelsea Creek Tower, priced between £2,520,000 and £2,800,000.
At SW6's other large scale new developments Fulham Riverside and Lillie Square, no sales were recorded.
The lack of sales with high price tags dragged the overall average price down to £1,064,741 - a fall of 8.4% over the quarter and 6.8% over the year.
Marco Da Silva of local estate agents Brik says price falls are due to uncertainty caused by Brexit and stamp duty levels causing a bottle neck at the top of the market. " The fact that there is no stamp duty charged under £125,000, then 2% up to £250,000, and 5% up to £925,000, may have helped activity levels at the lower to mid-segment of the housing market, but the 10% levy to £1.5million and 12% above that has had a negative impact at the top-end of the market, best illustrated by the slump in home sales and prices in London’s prime areas, including Fulham.
"Mortgage interest relief, greater support for first-time buyers, capital gains tax, are among just some of the top issues that property professionals have already outlined among their main requirements, but ahead of next month’s Budget, it is stamp duty reform that is top of the UK property industry’s wish list for when the Chancellor Philip Hammond delivers his statement."
Looking further ahead, he says: "There are some clear signs that there will be further volatility as the UK’s two-year separation from the EU unfolds, which will have an adverse impact on activity levels in the property market.
"But the inherent undersupply of housing means that property prices are likely to increase further in the medium to long term, even if there is a dip in the short term."
The Office of National Statistic's House Price Index is showing that the average price of a home sold in England and Wales was £219,544 in December 2016 up by 7.2%. Having been consistently above the levels seen in the rest of the country prices in London are now rising less quickly than the overall average and now stands at £484,000. This is the first time home values in the capital have underperformed the rest of the country since the financial crisis in 2008.
The number of property sales in England in October 2016, the latest figure available was down 34.5% year on year.
A detailed listing of properties sold recently in the area will be appearing in a forthcoming edition of the Fulham newsletter.
Fulham Property Prices (October - December 2016) |
||||||||
|---|---|---|---|---|---|---|---|---|
Area |
Semi-det |
Sales |
Terraced |
Sales |
Flat/ mais |
Sales |
Overall ave |
Total sales |
| SW6 1 | 0 | 0 | 1645000 | 2 | 708333 | 3 | 1083000 | 5 |
| SW6 2 | 0 | 0 | 1028333 | 3 | 1010579 | 22 | 1012710 | 25 |
| SW6 3 | 2425000 | 1 | 1999000 | 5 | 803250 | 8 | 1346143 | 14 |
| SW6 4 | 1405000 | 1 | 2295000 | 3 | 607375 | 10 | 1025982 | 14 |
| SW6 5 | 0 | 0 | 1477917 | 6 | 644000 | 5 | 1098864 | 11 |
| SW6 6 | 0 | 0 | 2168750 | 8 | 616346 | 13 | 1207738 | 21 |
| SW6 7 | 0 | 0 | 1074750 | 4 | 597583 | 12 | 716875 | 16 |
| Total | 1915000 | 2 | 1734565 | 31 | 757000 | 73 | 1064741 | 106 |
| Change over quarter | 2.5% | -35.4% | -21.1% | -48.2% | -8.4% | -44.5% | ||
| Change over year | -0.5% | -59.7% | -14.2% | -59.0% | -6.8% | -58.4% | ||
| Change over three years | 25.6% | -63.5% | 18.7% | -71.9% | 23.8% | -70.1% | ||
| Change over five years | 52.8% | -70.8% | 67.3% | -61.4% | 52.6% | -64.1% | ||
| Change over ten years | 131.9% | -77.7% | 97.6% | -76.4% | 112.1% | -76.8% | ||
February 24, 2017
Related links
|

