News

Stoll Veterans Accuse Greg Hands of ‘Going Missing in Action’
Residents dispute claims made in MP’s letter

Man Behind UK's Largest Indoor Arena Says Hammersmith is Next
Talks underway for a similar venue to the Co-op Live in Manchester

Olympia Hotels Given Late Licences Despite Residents' Objections
Will be able to serve guests 24 hours a day

Hourly Week Day River Bus Service Introduced at Local Piers
Putney, Wandsworth Riverside Quarter and Chelsea Harbour to benefit
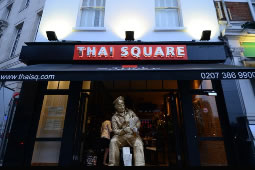
Thai Square is Back on Broadway in April
Long awaited reopening for restaurant closed during pandemic
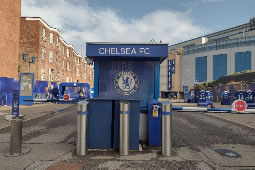
Chelsea FC Finalises Stoll Mansions Purchase
Residents to be rehoused on the Kings Road Park estate

A Tribute to Dr Jenny Vaughan from Cllr Stephen Cowan
Hammersmith & Fulham leader marks the passing of former councillor
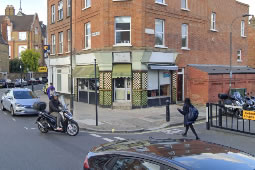
Former Cafe Gets Alcohol Licence Despite Residents' Opposition
Danish Patisserie on Munster Road is being converted into convenience store

CCTV Footage Released After Fatal Collision on Talgarth Road
Two people sought in connection with death of Ina Rodrigues

Fulham Palace Road Resident Faces Murder Charge
Khuedr Al Kurdi accused of involvement in West Kensington shooting

Minister Wants Hammersmith Bridge Open to 'All Forms of Traffic'
But Huw Merriman says final decision is down to the council

Government Gives Funding for Hammersmith Bridge Cycle Lane
Will open in November after resurfacing work
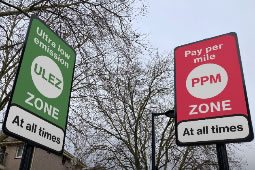
Row Breaks Out Over 'Pay-per-mile' Sign in Mayoral Election
Tory candidate's claim that Sadiq Khan wants to introduce it dismissed

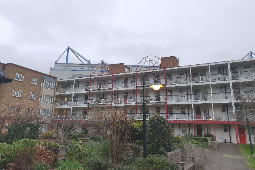
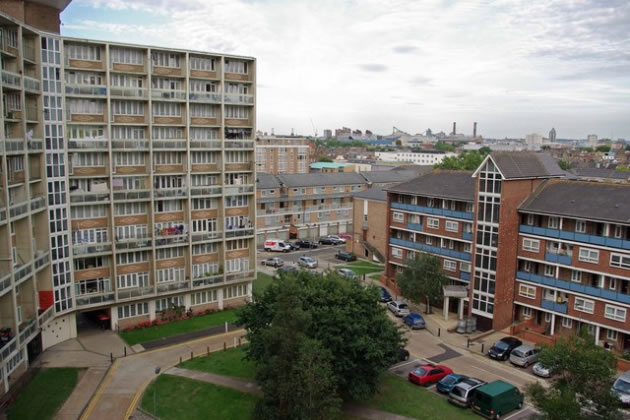
Man Dies After Falling from Clem Attlee Estate Tower Block
Death not being treated as suspicious by police
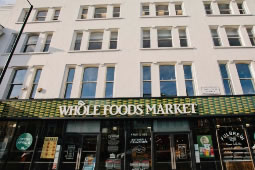
Whole Foods Set to Close and New Wetherspoons to Open
More major upheavals on Fulham Broadway in 2024

Fulham Man Takes on Football Stadium Cycling Challenge
Peter Brooks was inspired by care daughter received at Chelsea & Westminster
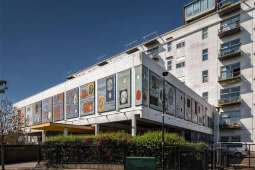
Lots Road Auctions Moves to Fulham
Famous saleroom finds temporary home in the Piper Building
Man Seriously Injured in Clancarty Road Stabbing
Suspects believed to have driven away on a moped

Gove Takes Aim at Hammersmith & Fulham Over Housing
Summons Chief Executive to discuss damning Ombudsman report
Fulham Broadway Bank Services Set to Shrink in Spring
Barclays to close and Metro Bank to slash opening hours

£4.6million Payout for Unfairly Sacked Council Officer
Hammersmith & Fulham fired Rachael Wright-Turner while she was on sick leave

New Flats Claim to be Made in Chelsea
Despite the fact that riverside developments are firmly in Fulham

David Lloyd Club Reopens After Multi-Million Pound Upgrade
Adding to choice of gyms in Fulham to suit every budget
Housing Watchdog Slams Hammersmith & Fulham Council
Ombudsman report describes systematic failure in its provision

Fulham FC Advances Plans to Open New Riverside Stand
Club applies for alcohol licences for venues including bar on riverwalk
Previously on FulhamSW6.com
Stories that have appeared in this site's newsletter
Calendar

Feminist Take on Tudor History at the Barons Court Theatre
Three Queens looks at one sleepless night in February 1554

Train Drivers Announce Another Round of Rolling Strikes
Disruption expected after the May Bank Holiday weekend

Fulham Palace to Hold Annual Green Meet
Explore ecology, biodiversity and sustainability through a range of activities

Fulham Girlguiding Trustee Taking on London Marathon
Fundraising to show girls they can do anything

Subversive Tea Towels on Display at Riverside Studios
Textile artist Holly Searle exhibits work done during lockdown

Wandsworth Bridge Road Spring Fayre is Back for Third Year
Local residents and businesses invited to help make it another big success

Forthcoming Transport Disruption in Fulham
Tubes and train services affected due to engineering works and strikes

Planned Roadworks in Fulham
Expect traffic delays in the SW6 area due to road closures

Tube Strikes Suspended After Talks Make Progress
TfL agrees to not change working arrangements without agreement

New William Morris Society Exhibition on Art of Wallpaper
Displays feature designs from the Sanderson Design Group archive

Fulham Good Neighbours – The Movie
Local charity looks to encourage people needing support to 'Enter the Fold'

Rocks Lane Bishops Park Tennis Socials
Extra Tennis Social sessions added including Senior and Pride
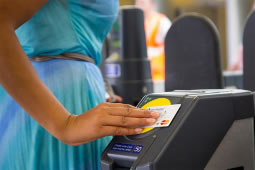
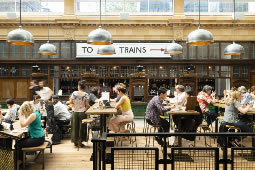
Off-peak All Day Fridays To Be Trialed on Tube and Rail
New fare structure to be introduced on 8 March

Lion Appears at Fulham Palace Road School
Kensington Wade celebrates Chinese New Year
Lifestyle

Spotlight on Parkinson's Disease this April with Home Instead
Help us support Parkinson’s UK with our fundraising initiative and open day
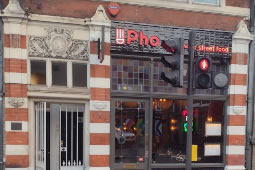
Pho Opens Its Doors on Fulham Broadway
Adding Vietnamese street food to local mix of Oriental cuisines
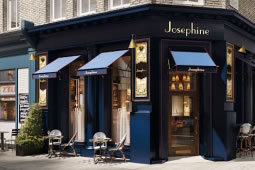
Claude Bosi To Open Another Restaurant on Fulham Road
Lyonnaise-style brasserie named in tribute to his grandmother
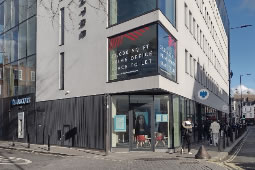
JD Wetherspoon Plans Fulham Broadway Comeback
With £2.5 million scheme to take over empty station ticket hall
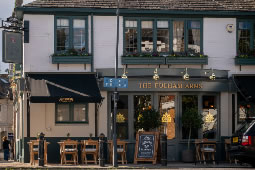
Sands End Pub Relaunches as the Fulham Arms
Venue is now managed by Butcombe Pubs and Inns
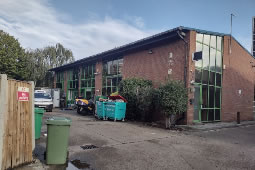
Fulham's Secret Dark Kitchens Continue to Grow
New units planned to meet huge demand for delivery meals
Chelsea's Blue Lion to Guard Gates of Stamford Bridge
Football club’s new owner plans to install 'innovative artistic' sculptures
Property
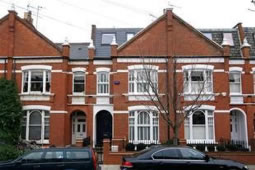
Fulham has London's 'Best Stock of Family Houses'
Brisk activity in premium-price homes in generally slow market

Council Snaps Up Flats in Sands End Development
37 units in Chelsea Riverview scheme to be provided as affordable housing
Community

Guardians of the Galaxy Star Becomes Local Mind Ambassador
Will Poulter helping spread the message on mental health

What Happens To Asylum Seekers in Hammersmith & Fulham
Home Office reported to be housing them in five hotels in the borough
Latest Job Opportunities in Fulham
What's on offer in SW6 this week

Earls Court Community Fund Hands Out £180,000
Over twenty local organisations receive grants

Fulham War Veteran Charles Daley Remembered
MP dedicates constituency tribute to him in Commons Garden of Remembrance